WESTERN PRODUCER — Last fall on her farm near Holland, Man., Anastasia Kubinec was struggling with a decision about a canola field.
In one part of the of the field, it seemed like the crop was ready to combine.
But other areas were possibly too wet and too green.
One option was going in with the combine and taking samples in different parts of the field.
But there was a risk of completely plugging the combine with wet canola.
Instead, Kubinec took a different approach.
“We were using satellite imagery and drones to figure out … which areas of the field could be combined earlier (because) of lower seed moisture,” said Kubinec, who spoke last month at Manitoba Ag Days in Brandon.
“We were selectively combining specific areas of the field (based) on the satellite imagery.”
Kubinec was able to keep the combine rolling at harvest time rather than waiting for the entire field to dry, thanks to the satellite images and thoughtful sampling of the crop.
“We were able to combine certain areas of the field, then go to the next canola field and combine certain areas of that field.”
The strategic combining may have saved Kubinec a few hours at harvest time.
More importantly, the satellite images helped her make the right choice in the moment.
“It’s a tool. It’s a decision-making tool,” said Kubinec, who also works as an agronomist for Paterson Grain in Holland.
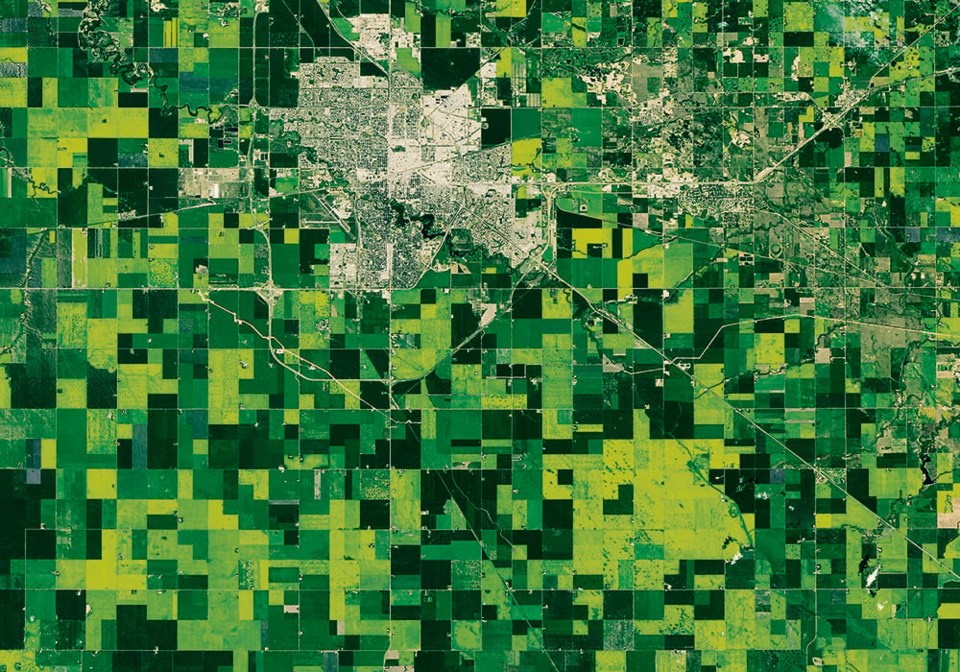
There are different types of satellite imagery and different services available to growers.
However, one of the main products is NDVI, which can estimate the amount of biomass in a field.
NDVI, which stands for normalized difference vegetation index, is a simple graphical indicator that can be used to describe the difference between visible and near-infrared reflectance of vegetation cover to measure how much of the crop is actively doing photosynthesis.
The small number of Canadian farmers who look at satellite images of their cropland are mostly using it for the same purpose.
“When I talk to farmers, the most common thing … people are using it to find anomalies (in a field). ‘Whoa, what’s going on over there?’ ” said Greg Stewart, owner and founder of Geco Engineering, a Vancouver company that uses satellite images to predict where weeds will emerge.
“They’ll see a vegetative anomaly (in the satellite image) … then they’ll go look at it (in the field).”
On her farm, Kubinec uses the satellite images in combination with drones to monitor crop development during the growing season.
“Really, it’s just telling you biomass or NDVI within the field. Then you can go to those specific areas of the field and see, ‘oh, maybe it’s big flush of weeds, or maybe the crop is quite thick there. In other areas it might be thin,’ ” she said.
“With the drone, in addition to satellite imagery and boots on the ground, is probably my best indication of what is going on in the field…. I’m using them in tandem.”
During last year’s harvest, Kubinec used the biomass data from the satellite to gauge the dryness of the canola and if it was ready to combine.
In some cases the satellite data is not complicated. It could be colour coded to indicate which parts of the field have more biomass or less.
“It’s becoming very advanced and very user friendly for farmers,” said Kubinec, who added that satellites can be used to make prescriptive maps for fungicide application.
“So, when you’re going in to apply fungicide … you could be in areas where there is no crop. (With) sectional control you can turn it off and not spray those areas,” she said.
“(In) areas that are quite thick, you could put on a higher application rate because you have more canopy you need to get through.”
Stewart and Geco Engineering provides a service that can help growers save money on herbicides by focusing on parts of the field that are more likely to have weeds.
Geco uses five years of satellite images and artificial intelligence to generate a predictive map of where weeds are likely to appear in the next growing season.
“That turns into a prescription map that you can load into your granular applicator or sprayer,” Stewart said, which allows growers to vary the amount of soil-applied herbicide and focus on the “weediest hot spots and hit them hard.”
“It typically reduces the cost (of soil-applied herbicide) by about 50 percent,” he added.
Looking ahead five or 10 years, it’s almost certain that the resolution of satellite imagery will improve.
For now, most satellite images work at a resolution of 10 metres and down to three metres, so it’s almost impossible to see individual plants.
“You can get down to 12 centimetres, I believe, it’s just extraordinarily expensive,” Stewart said.
The cost of resolution is dropping, which is good news for farmers and companies that want to sell satellite imagery services to growers.
As the resolution improves, the analysis and diagnosis of what’s happening in a particular field will also improve when it comes to things like crop fertility, diseases and pests.
“As a result, it will get used more,” Stewart said.
“(But) it has to be solving real (problems) for farmers … and (identify) the things that are actionable.”
If Stewart is correct, satellite images could become a commonplace tool on Canadian grain farms.
However, as of 2024, it could be an underused tool on Canadian farms.
“I believe it is,” Kubinec said.
“As we have more farmers entering (the business) that have less gray hair than I do, I think it will be utilized more.”


