WESTERN PRODUCER — Seed segregation maximizes price premiums for producers, and consumers worldwide are becoming more discerning about their food.
In response, commodity buyers and food processors often offer price premiums for specified characteristics.
To make the most of those price premiums, producers need to measure and document the characteristics of grain going through their combines. Price premiums might be offered for factors such as oil content, protein, starch, falling numbers and seed size.
Differentiation and identity preservation (IP) become critical factors at harvest. Noticing and segregating higher value crop as it runs through the combine allows the producer to bin it separately.
For example, if there’s a price premium on high protein grain, a grower might decide to harvest the knolls first and haul that grain to designated bins. Knowing the protein of grain going through the combine allows him to combine the tops of the knoll and down the slope until protein begins to drop off.
However, how can producers know the edges of those protein zones? The layers of maps they produce will certainly help, but maps are just history. To make the most of possible premiums, they need to know exactly what’s going into the tank today, at this moment. And they need geo-referenced data if they expect to compare genuine believable protein numbers to existing field maps.
If their combine could analyze grain as it’s going into the hopper, they could make those critical IP decisions on the go, from the cab, in real time. If the grain monitor is accurate, they could differentiate the various grades as they harvest.
However, that would require a pretty fancy monitoring device.
Grain-Q
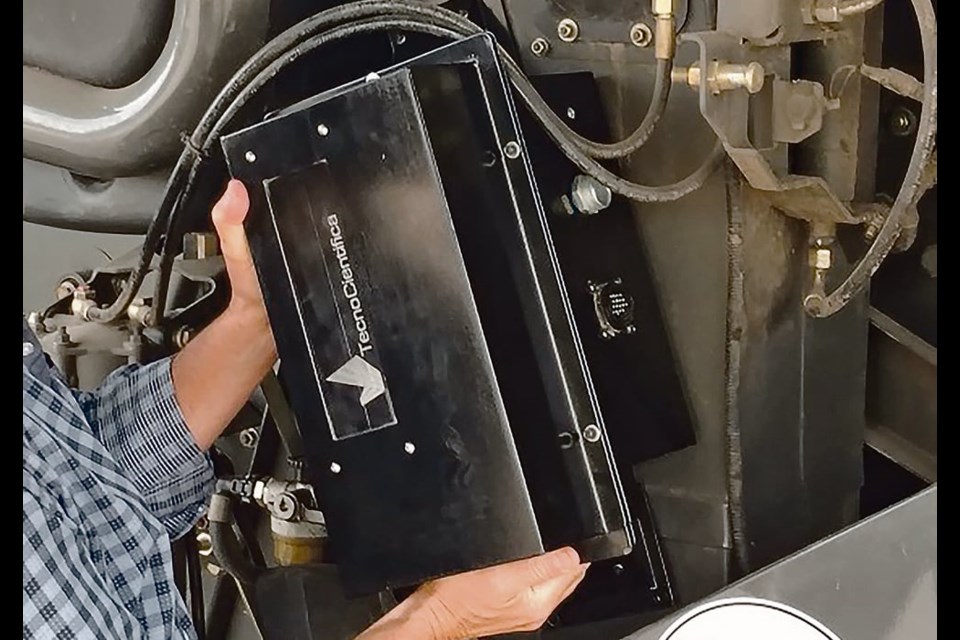
Such a high tech grain monitor is what Gustavo Caneda of Tecnocientifica is manufacturing in his Argentine factory. His Grain-Q system uses a near infrared (NIR) sensor that has been calibrated to analyze most crops commonly grown in North America:
- Wheat — moisture, protein and gluten
- Barley — moisture and protein
- Soybeans — moisture, protein and fat
- Corn – moisture and potentially starch, protein and fat
Canola calibrations will be developed for moisture, oil fat and protein.
Caneda said his Grain-Q pulls one sample every 20 seconds from the clean grain elevator. This creates a massive volume of data that not only allows on-the-go decisions, but adds vital information to a farmer’s existing soil fertility maps and next year’s crop plans.
“Grain-Q data is a valuable management tool. It gives you very strong numbers because you know exactly what went into the truck off the combine. And you know the exact geo-referenced spot in the field where that grain was grown,” Caneda said.
“We focus on qualifying and quantifying chemical composition. We use the power of NIR light and its interaction with the molecules that are pouring into the tank at that moment.
“A farmer is dealing with history when he depends on map layers for weather, past yields, crop protection, varieties and all the other agronomic factors. Real-time data lets you optimize your inputs. Merging Grain-Q harvest data with existing maps lets you make better decisions for next year.”
A combine is a dusty, shaky, torturous home for a delicate device like an NIR sensor. Caneda said the mounting apparatus is the secret to making it last without downtime. The NIR spectrometer module is separate from the sensor itself.
The important thing is to prevent vibration between the light source and the sensor. The relationship of these two instruments must remain constant. He said the system has proven to be robust in severe testing conditions.
“Installation is very simple — two or three hours, a half day at most. You cut two square holes in the sheet metal, one for the light and one for the sensor. Then fasten the black box and install wires to the computer. After that, the Grain-Q is ready to work just like it’s a grain laboratory on your combine because that’s what it is.”
He said the combine requires no modification, other than cutting the two holes in sheet metal. The same unit functions equally well on every combination of crop and combine a farmer might encounter.
The Grain-Q will list for about US$30,000.
T-Scanner
Gone are the days of pulling grain samples with probes and cups and then mixing them and hauling them to a testing facility. Even the robotic penetrating arms that shoots a grain sample down a long pneumatic tube have been made obsolete by Canada’s latest application of NIR technology, called the T-Scanner.
It uses the same automated robotic arm that penetrates the grain load on a truck or trailer, but the tip of the arm is an NIR system that analyzes all the grain in that vessel.
It’s a version of the Grain-Q technology, modified for scanning grain loads, and uses a complex mathematical bisection method to find the average of high section, middle section and lower section of the grain load.
“Our sensor is like an eye that is installed at the spear,” Caneda said.
“Once the spear is into the grain, we begin to scan, so they don’t need to send the sample to the lab because when the spear pulls out, they’ve already got all the data. So they say they are saving time. It’s super fast. They can make decisions at the same moment.
“Instead of taking a sample and bringing it to the lab or to the instrument, we are sending the instrument into the sample and it’s scanning the full thing. We are collecting data for the whole truckload. There’s no other system in the world that can do that.”
Caneda said the T-Scanner is already available in South America and should be on the North American market within a year through the established North American auto sampling industry.
The system will sell for about $40,000.
NIR Tecnocientifica
There’s nothing new about near-Infrared spectrometry, considering that near-Infrared light waves were discovered in 1800 and first used in industrial applications in the 1960s and combined with spectroscopy in the 1980s.
Caneda has been developing NIR analytical equipment for years.
“In 1991 at a trade show, I came across my first dickey-john NIR Spectrophotometer, designed for the measurement of grains and derivatives,” he said.
“Their representatives knew little about how to develop this expensive instrument to market in our country. They placed it on the counter of their stand and asked me, ‘do you have any idea how to make this work and sell?’
“That was the start for me. Well, we’ve been crazy. We are crazy about technology and we are innovating all the time and we are very proud about it.”