WESTERN PRODUCER — Historical soil data combined with satellite imagery is being used to create models that can accurately predict soil properties, including the most precise soil-texture map currently available in Saskatchewan.
Researchers from the University of Saskatchewan already created a synthetic bare soil map with data from the Google Earth Engine (GEE) to predict soil properties.
However, there are areas in the province that do not have images available of bare soil, said Preston Sorenson from the Department of Soil Science at the University of Saskatchewan.
“This study aimed to map a range of soil properties throughout the entire agricultural region of Saskatchewan by integrating bare soil composite imagery with other remote sensing data,” Sorenson said during a presentation at the College of Agriculture and Bioresources Soils and Crops virtual conference.
Images from the Landsat 5 satellites from July to August, from 1984 to 1995, were retrieved from GEE, then filtered based on normalized difference vegetation index (NDVI), normalized difference water index (NDWI), normalized burn ratio (NDR), and normalized difference index seven (NDI7).
The resulting stack of pixels were used to calculate the median values for each band, and for each pixel in order to have one image that could be used for predictive modelling purposes.
“In order to account for other variables and also to account for sites where bare soil imagery is not present, we also looked at factors such as the anthocyanin reflectance index, canopy response salinity index, normalized difference vegetation index both the standard deviation and median values and then the soil adjusted vegetation index,” Sorenson said
He said the Landsat 5 data from 1984 to 1995 was used because bare soil imagery is difficult to generate using modern imagery in Saskatchewan because there’s often crop residues on the soil.
For climate variables including precipitation and temperature, climate reanalysis data by the European Center for Medium-Range Weather Forecasts was used.
Terrain was accounted for by using terrain ruggedness index, standard deviation of elevation, and landscape scale morphometric terrain derivatives.
“We put all these variables together including the bare soil imagery to create a raster stack and then we used a recursive feature elimination process to select the optimal features for each soil parameter,” Sorenson said
The CanSIS National Pedon Database was used for training data.
The soil parameters evaluated included A-horizon (topsoil) soil organic carbon, total nitrogen, cation exchange capacity, electrical conductivity, inorganic carbon, and sand and clay content. Solum electrical conductivity, and sand and clay content along with profile soil organic carbon stocks, electrical conductivity, inorganic carbon, and sand and clay content were also evaluated.
The study’s results were comparable to previous studies for soil organic carbon.
“We can very much get the overall trend in soil carbon data from this. But of course, there’s still a high degree of variability and it’s by no means perfect,” Sorenson said.
He said the general trend in cation exchange capacity and nitrogen levels could also be found by using the historical datasets.
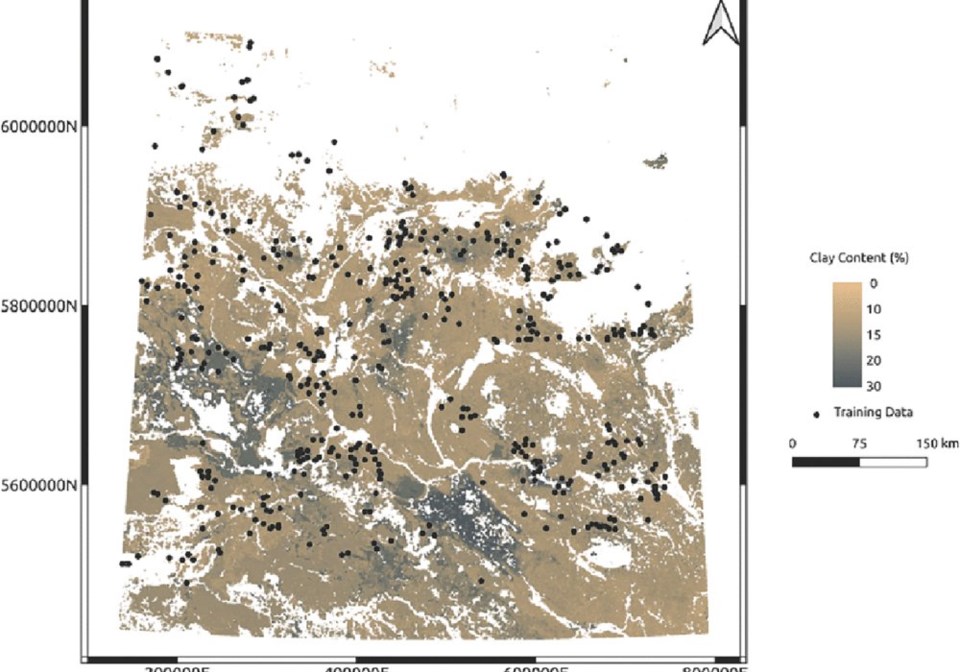
“We actually had the best results for predicting clay content. These results are quite a bit better than the results we had for using bare soil composite imagery only,” he said.
The model could not predict sand content as well as it could clay content, but Sorenson said general trends can still be pulled from the model.
Users of the model can switch between different soil parameters they want to look at including, A-Horizon, soil organic carbon, total nitrogen, and cation exchange capacity, and a soil texture map.
The maps are at a 100-metre resolution` and there is some smoothing around the edge of the pixels based on the variations in the surrounding pixels.
Sorenson said this needs to be considered when interpreting the maps.
“We’re able to pull out some of these higher clay content zones. In terms of how we look at this map, the yellows and oranges are sandier textures, the grays and dark blues are clay contents, and the greens are the siltier soil textures,” he said.
“There’s a number of patterns now that we’re able to pull out for some much more spatially precise mapping of soil texture than what’s currently available for Saskatchewan.”
He said the model will provide better results once the data is better trained, and a higher resolution digital elevation model is used.