
The Saskatchewan real estate market continues to be strong and outperform last year’s market. Across the province, sales were up 38.4% from last October (and up 20.4% year-to-date, going from 987 to 1,366), new listings were up 1.0% (but down 6.6% year-to-date), going from 2,002 to 2,023, and the median sale price was up 7.8% (up 3.6% year-to-date), going from $255,000 to $275,000. Inventories were also down in 16 of the 19 markets that the SRA tracks.
Consumer confidence is high in Saskatchewan despite falling economic resilience across the country due to the emergence of a second wave of COVID-19. “The protocols that we put in place back in April to keep REALTORS® and their clients safe,” said SRA CEO Jason Yochim, “has helped ease people’s anxiety when it comes to buying and selling real estate.”
Combined with the government’s early efforts to minimize the spread of COVID and to safely re-open the economy as quickly as possible, the SRA’s actions have been critical in helping keep consumer confidence high. “We saw that COVID didn’t stop people from participating in the real estate market,” said Yochim, “but they also need to feel safe.”
The confidence that people have shown has been great for the Saskatchewan real estate market. Median sales prices were up in 11 of the 19 markets that the SRA tracks (with Prince Albert and Swift Current seeing the largest drops while Estevan and Weyburn saw the greatest gains), while the number of sales were up in 15 of 19 markets (with Weyburn and Melfort seeing the largest drop while Regina and Saskatoon had significant gains). Increases in sales and prices combined with falling inventories suggests that these markets continue to be resilient.
Overall, the real estate market in October continues the trends that we have seen since the provincial economy reopened. Although the market is slowing compared with the performance that we saw over the summer, this October was stronger than it was last year.
Although COVID numbers are beginning to increase across the country and in the province, the SRA continues to work on measures to help minimize the spread of the virus while allowing people to buy and sell real estate safely. With the province mandating masks in public spaces in Prince Albert, Regina, and Saskatoon and capping public gatherings at 10 people, the SRA is going one step further and requiring all of its members across Saskatchewan to wear masks at all times while meeting with clients as of Friday November 6th.
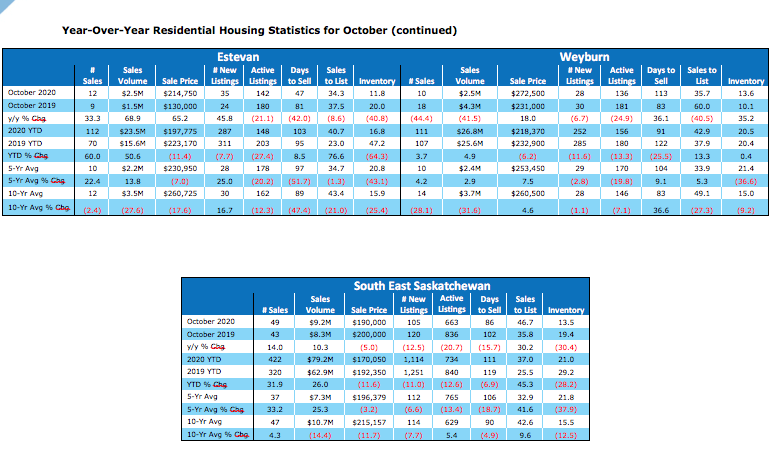
South East Saskatchewan
Sales in south east Saskatchewan were up 14.0%, going from 43 in October 2019 to 49 in October 2020, up 33.2% from the 5-year average (and 4.3% above the 10-year average). The total number of sales in Estevan rose 33.0% (going from 9 to 12) and fell 44.4% in Weyburn (going from 18 to 10). Sales in Estevan were 22.4% above the 5-year average (and 2.4% below the 10-year average), while they were 4.2% above the 5-year average (and 28.1% below the 10-year average) in Weyburn. Year-to-Date (YTD) sales in the overall region were up 31.9% over last year, going from 43 to 49, and with YTD sales in Estevan rising from 70 to 112, and rising 3.7% in Weyburn, going from 107 to 111.
Sales volume in the region rose 10.3%, going from $8.3M to $9.2M in 2020 (25.3% above the 5-year average, and 14.4% below the 10-year average). Sales volume in Estevan rose 50.6%—$15.6M to $23.5M in 2020 (13.8% above the 5-year average and 27.6% below the 10-year average), while it decreased 41.5% in Weyburn—$4.3M to $2.5M (2.9% above the 5-year average and 31.6% below the 10-year average). YTD sales volume in the region rose from $62.9M to $79.2M in 2020 (an increase of 26.0%), with Estevan seeing a 50.6% rise and Weyburn seeing a 3.7% rise in the YTD sales volume.
The number of new listings in south east Saskatchewan fell 12.5%, going from 120 to 105 (6.6% below the 5-year average and 7.7% below the 10-year average). The number of new listings in Estevan were up from 24 last year to 35 this year (a rise of 45.8%), while in Weyburn, new listings decreased from 30 last year to 28 this year (a fall of 6.7%). Active listings were down 20.7% across the region (836 in 2019 to 663 in 2020), down 21.1% in Estevan (180 to 142), and down 24.9% in Weyburn (181 to 136).
Inventory in south east Saskatchewan stood at 13.5 months (which is 30.4% below the level last year and 37.9% below the 5-year average), while the sales to listing ratio was 46.7%, suggesting balanced market conditions. Inventory in Estevan stood at 11.8 months (which is 40.8% below the level last year and 43.1% below the 5-year average), while the sales to listing ratio was 34.3%, suggesting that market conditions favour buyers. Inventory in Weyburn stood at 13.6 months (which is 35.2% above the level last year and 36.6% below the 5-year average), while the sales to listing ratio was 35.7%, suggesting that market conditions favour buyers.
In 2020, homes stayed on the market an average of 86 days in south east Saskatchewan, down 15.7% from 102 days last year (and 18.7% below the 5-year average of 106 days and 4.9% below the 10-year average of 90 days). Homes in Estevan stayed on the market for less time than homes in the larger region at 47 days on average in 2020, but also down from an average of 81 days last year (and 51.7% below the 5-year average). Homes in Weyburn stayed on the market longer than homes in the larger region at 113 days on average in 2020, but also up from an average of 83 days last year (and 9.1% above the 5-year average).
Median home prices in the region fell 5.0%, going from $200,000 to $190,000 (3.2% below the 5-year average median price of $196,379 and 11.7% below the 10-year average median price of $215,157). Year-to-date, the median home price in south east Saskatchewan was $170,050 which is 11.6% below the $192,350 price from the same time last year. Median home prices in Estevan went from $130,000 to $214,750 (an increase of 65.2%) and were approximately 7.0% below the 5-year and 17.6% below the 10-year average median price. Year-to-date, the median home price in the region was $197,775 which is 11.4% below the $223,170 price from the same time last year. Median home prices in Weyburn went from $231,000 to $272,500 (an increase of 18.0%) and were approximately 7.5% above the 5-year and 4.6% above the 10-year average median price. Year-to-date, the median home price in the region was $218,370 which is 6.2% below the $232,900 price from the same time last year.
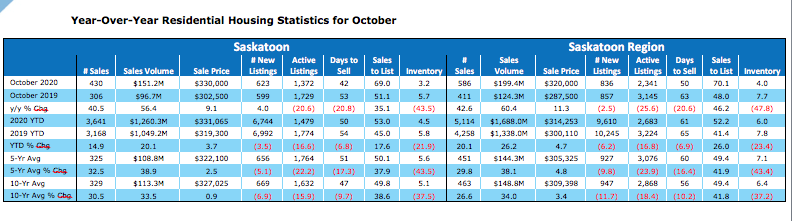
Saskatoon
Sales in Saskatoon were up 40.5%, going from 306 in October 2019 to 430 in October 2020, and up 42.6% in the overall region, going from 411 to 586. In Saskatoon, sales were 32.5% above the 5-year average (and 30.5% above the 10-year average), while in the larger region, sales were 29.8% above the 5-year average (and 26.6% above the 10-year average). Year-to-Date (YTD) sales in Saskatoon rose 14.9% over last year, increasing from 3,168 to 3,641, while YTD sales in the larger region rose 20.1%, going from 4,258 to 5,114.
Sales volume was up 56.4% in the city, going from $96.7M to $151.2M in 2020 (38.9% above the 5-year average, and 33.5% above the 10-year average). YTD sales volume in the city was $1,260.3M, an increase of 20.1% from last year. In the region, sales volume was up 26.2%, going from $1,338.0M to $1,688.0M (38.1% above the 5-year average and 34.0% above the 10-year average). YTD sales volume increased 26.2% in the region, rising from $1,338.0M in 2019 to $1,688.0M in 2020.
In Saskatoon, the number of new listings in October 2020 rose 4.0%, going from 599 to 623 (5.1% below the 5-year average and 6.9% below the 10-year average), while in the region, new listings fell 2.5% from 857 last year to 836 this year (9.8% below the 5-year average and 11.7% below the 10-year average). YTD new listings in the city fell 3.5%, going from 6,992 to 6,744, while in the larger region, the number of new listings to date fell 6.2%, going from 10,245 to 9,610. Active listings fell 20.6% in Saskatoon (down from 1,729 to 1,372) and fell 25.6% in the region (down from 3,145 to 2,341).
Inventory in Saskatoon stood at 3.2 months (which is 43.5% below the level last year and 43.5% below the 5-year average), while the sales to listing ratio was 69.0%, suggesting that market conditions favour sellers. Inventory in the larger region stood at 4.0 months (which is 47.8% below the level last year and 43.4% below the 5-year average), while the sales to listing ratio was 70.1%, suggesting that market conditions favour sellers.
Homes in Saskatoon stayed on the market an average of 42 days in October—down 20.8% from 53 days last year (but below the 5-year average of 51 days and below the 10-year average of 46 days). Homes in the region stayed on the market longer than homes in the city at 50 days on average in 2020, but also down from an average of 63 days last year (and 16.4% below the 5-year average).
Median home prices in Saskatoon went from $302,500 to $330,000 (an increase of 9.1%) and were approximately 2.5% above the 5-year and 0.9% above the 10-year average median price. The MLS® Home Price Index (HPI)—a more accurate measure of house price trends—is up 0.3% from $322,700 to $323,600. Year-to-date, the median home price in Saskatoon was $331,065 which is 3.7% above the $319,300 price from the same time last year. Median home prices in the region went from $287,500 to $320,000 (an increase of 11.3%) and were approximately 4.8% above the 5-year and 3.4% above the 10-year average median price. Year-to-date, the median home price in the region was $314,252 which is 4.7% above the $300,110 price from the same time last year.
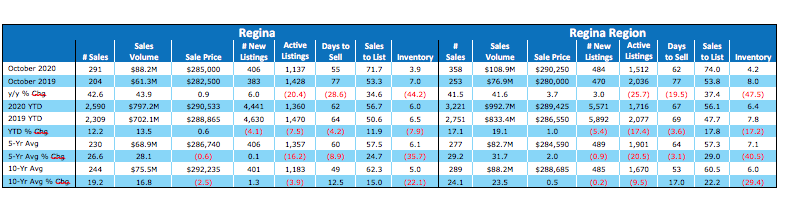
Regina
Sales in Regina were up 42.6%, going from 204 in October 2019 to 291 in October 2020, and up 41.5% in the overall region, going from 253 to 358. In Regina, sales were 26.6% above the 5-year average (and 19.2% above the 10-year average), while in the larger region, sales were 29.2% above the 5-year average (and 24.1% above the 10-year average). Year-to-Date (YTD) sales in Regina rose 12.2% over last year, increasing from 2,309 to 2,590, while YTD sales in the larger region rose 17.1%, going from 2,751 to 3,221.
Sales volume was up 43.9% in the city, going from $61.3M to $88.2M in 2020 (28.1% above the 5-year average, and 16.8% above the 10-year average). YTD sales volume in the city was $797.2M, an increase of 13.5% from last year. In the region, sales volume was up 19.1%, going from $833.4M to $992.7M (31.7% above the 5-year average and 23.5% above the 10-year average). YTD sales volume increased 19.1% in the region, rising from $833.4M in 2019 to $992.7M in 2020.
In Regina, the number of new listings in October 2020 rose 6.0%, going from 383 to 406 (0.1% above the 5-year average and 1.3% above the 10-year average), while in the region, new listings rose 3.0% from 470 last year to 484 this year (0.9% below the 5-year average and 0.2% below the 10-year average). YTD new listings in the city fell 4.1%, going from 4,630 to 4,441, while in the larger region, the number of new listings to date fell 5.4%, going from 5,892 to 5,571. Active listings fell 20.4% in Regina (down from 1,428 to 1,137) and fell 25.7% in the region (down from 2,036 to 1,512).
Inventory in Regina stood at 3.9 months (which is 44.2% below the level last year and 35.7% below the 5-year average), while the sales to listing ratio was 71.7%, suggesting that market conditions favour sellers. Inventory in the larger region stood at 4.2 months (which is 47.5% below the level last year and 40.5% below the 5-year average), while the sales to listing ratio was 74.0%, suggesting that market conditions favour sellers.
Homes in Regina stayed on the market an average of 55 days in October—down 28.6% from 77 days last year (but below the 5-year average of 60 days and above the 10-year average of 49 days). Homes in the region stayed on the market longer than homes in the city at 62 days on average in 2020, but also down from an average of 77 days last year (and 3.1% below the 5-year average).
Median home prices in Regina went from $282,500 to $285,000 (an increase of 0.9%) and were approximately 0.6% below the 5-year and 2.5% below the 10-year average median price. The MLS® Home Price Index (HPI)—a more accurate measure of house price trends—is essentially flat, with the benchmark single-family home price going from $290,700 to $290,600. Year-to-date, the median home price in Regina was $290,532 which is 0.6% above the $288,865 price from the same time last year. Median home prices in the region went from $280,000 to $290,250 (an increase of 3.7%) and were approximately 2.0% above the 5-year and 0.5% above the 10-year average median price. Year-to-date, the median home price in the region was $289,425 which is 1.0% above the $286,550 price from the same time last year.
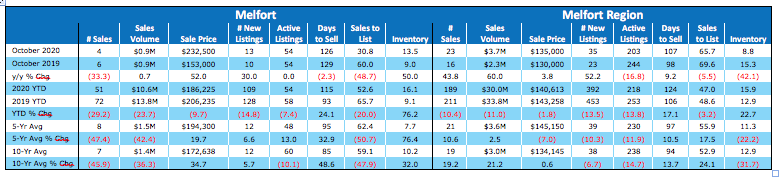
Melfort
Sales in Melfort were down 33.3%, going from 6 in October 2019 to 4 in October 2020, and up 43.8% in the overall region, going from 16 to 23. In Melfort, sales were 47.4% below the 5-year average (and 45.9% below the 10-year average), while in the larger region, sales were 10.6% above the 5-year average (and 19.2% above the 10-year average). Year-to-Date (YTD) sales in Melfort fell 29.2% over last year, decreasing from 72 to 51, while YTD sales in the larger region fell 10.4%, going from 211 to 189.
Sales volume was up 0.7% in the city, going from $0.9M to $0.9M in 2020 (42.4% below the 5-year average, and 36.3% below the 10-year average). YTD sales volume in the city was $10.6M, a decrease of 23.7% from last year. In the region, sales volume was down 11.0%, going from $33.8M to $30.0M (2.5% above the 5-year average and 21.2% above the 10-year average). YTD sales volume decreased 11.0% in the region, falling from $33.8M in 2019 to $30.0M in 2020.
In Melfort, the number of new listings in October 2020 rose 30.0%, going from 10 to 13 (6.6% above the 5-year average and 5.7% above the 10-year average), while in the region, new listings rose 52.2% from 23 last year to 35 this year (10.3% below the 5-year average and 6.7% below the 10-year average). YTD new listings in the city fell 14.8%, going from 128 to 109, while in the larger region, the number of new listings to date fell 13.5%, going from 453 to 392. Active listings stayed flat in Melfort at 54 but fell 16.8% in the region (down from 244 to 203).
Inventory in Melfort stood at 13.5 months (which is 50.0% above the level last year and 76.4% above the 5-year average), while the sales to listing ratio was 30.8%, suggesting that market conditions favour buyers. Inventory in the larger region stood at 8.8 months (which is 42.1% below the level last year and 22.2% below the 5-year average), while the sales to listing ratio was 65.7%, suggesting that market conditions favour sellers.
Homes in Melfort stayed on the market an average of 126 days in October—down 2.3% from 129 days last year (and above the 5-year average of 95 days and above the 10-year average of 85 days). Homes in the region stayed on the market for less time than homes in the city at 107 days on average in 2020, but also up from an average of 98 days last year (and 10.5% above the 5-year average).
Median home prices in Melfort went from $153,000 to $232,500 (an increase of 52%) and were approximately 19.7% above the 5-year and 34.7% above the 10-year average median price. Year-to-date, the median home price in Melfort was $186,225 which is 9.7% below the $206,235 price from the same time last year. Median home prices in the region went from $130,000 to $135,000 (an increase of 3.8%) and were approximately 7.0% below the 5-year and 0.6% above the 10-year average median price. Year-to-date, the median home price in the region was $140,612 which is 1.8% below the $143,258 price from the same time last year.
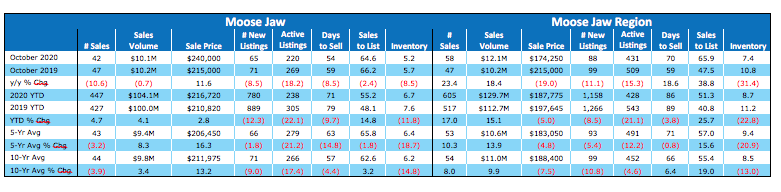
Moose Jaw
Sales in Moose Jaw were down 10.6%, going from 47 in October 2019 to 42 in October 2020, and up 23.4% in the overall region, going from 47 to 58. In Moose Jaw, sales were 3.2% below the 5-year average (and 3.9% below the 10-year average), while in the larger region, sales were 10.3% above the 5-year average (and 8.0% above the 10-year average). Year-to-Date (YTD) sales in Moose Jaw rose 4.7% over last year, increasing from 427 to 447, while YTD sales in the larger region rose 17.0%, going from 517 to 605.
Sales volume was down 0.7% in the city, going from $10.2M to $10.1M in 2020 (8.3% above the 5-year average, and 3.4% above the 10-year average). YTD sales volume in the city was $104.1M, an increase of 4.1% from last year. In the region, sales volume was up 15.1%, going from $112.7M to $129.7M (13.9% above the 5-year average and 9.9% above the 10-year average). YTD sales volume increased 15.1% in the region, rising from $112.7M in 2019 to $129.7M in 2020.
In Moose Jaw, the number of new listings in October 2020 fell 8.5%, going from 71 to 65 (1.8% below the 5-year average and 9.0% below the 10-year average), while in the region, new listings fell 11.1% from 99 last year to 88 this year (5.4% below the 5-year average and 10.8% below the 10-year average). YTD new listings in the city fell 12.3%, going from 889 to 780, while in the larger region, the number of new listings to date fell 8.5%, going from 1,266 to 1,158. Active listings fell 18.2% in Moose Jaw (down from 269 to 220) and fell 15.3% in the region (down from 509 to 431).
Inventory in Moose Jaw stood at 5.2 months (which is 8.5% below the level last year and 18.7% below the 5-year average), while the sales to listing ratio was 64.6%, suggesting that market conditions favour sellers. Inventory in the larger region stood at 7.4 months (which is 31.4% below the level last year and 20.9% below the 5-year average), while the sales to listing ratio was 65.9%, suggesting that market conditions favour sellers.
Homes in Moose Jaw stayed on the market an average of 54 days in October—down 8.5% from 59 days last year (but below the 5-year average of 63 days and below the 10-year average of 56 days). Homes in the region stayed on the market longer than homes in the city at 70 days on average in 2020, but also up from an average of 59 days last year (and 0.8% below the 5-year average).
Median home prices in Moose Jaw went from $215,000 to $240,000 (an increase of 11.6%) and were approximately 16.3% above the 5-year and 13.2% above the 10-year average median price. Year-to-date, the median home price in Moose Jaw was $216,720 which is 2.8% above the $210,820 price from the same time last year. Median home prices in the region went from $215,000 to $174,250 (a decrease of 19.0%) and were approximately 4.8% below the 5-year and 7.5% below the 10-year average median price. Year-to-date, the median home price in the region was $187,775 which is 5.0% below the $197,645 price from the same time last year.
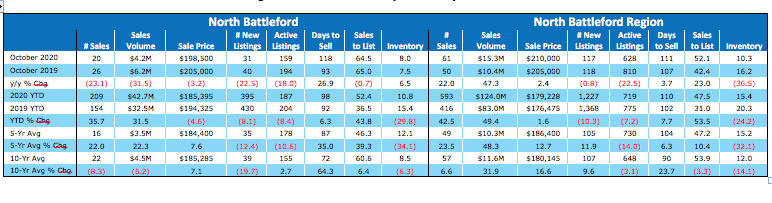
North Battleford
Sales in North Battleford were down 23.1%, going from 26 in October 2019 to 20 in October 2020, and up 22.0% in the overall region, going from 50 to 61. In North Battleford, sales were 22.0% above the 5-year average (and 8.3% below the 10-year average), while in the larger region, sales were 23.5% above the 5-year average (and 6.6% above the 10-year average). Year-to-Date (YTD) sales in North Battleford rose 35.7% over last year, increasing from 154 to 209, while YTD sales in the larger region rose 42.5%, going from 416 to 593.
Sales volume was down 31.5% in the city, going from $6.2M to $4.2M in 2020 (22.3% above the 5-year average, and 5.2% below the 10-year average). YTD sales volume in the city was $42.7M, an increase of 31.5% from last year. In the region, sales volume was up 49.4%, going from $83.0M to $124.0M (48.3% above the 5-year average and 31.9% above the 10-year average). YTD sales volume increased 49.4% in the region, rising from $83.0M in 2019 to $124.0M in 2020.
In North Battleford, the number of new listings in October 2020 fell 22.5%, going from 40 to 31 (12.4% below the 5-year average and 19.7% below the 10-year average), while in the region, new listings fell 0.8% from 118 last year to 117 this year (11.9% above the 5-year average and 9.6% above the 10-year average). YTD new listings in the city fell 8.1%, going from 430 to 395, while in the larger region, the number of new listings to date fell 10.3%, going from 1,368 to 1,227. Active listings fell 18.0% in North Battleford (down from 194 to 159) and fell 22.5% in the region (down from 810 to 628).
Inventory in North Battleford stood at 8.0 months (which is 6.5% above the level last year and 34.1% below the 5-year average), while the sales to listing ratio was 64.5%, suggesting that market conditions favour sellers. Inventory in the larger region stood at 10.3 months (which is 36.5% below the level last year and 32.1% below the 5-year average), while the sales to listing ratio was 52.1%, suggesting balanced market conditions.
Homes in North Battleford stayed on the market an average of 118 days in October—up 26.9% from 93 days last year (and above the 5-year average of 87 days and above the 10-year average of 72 days). Homes in the region stayed on the market for less time than homes in the city at 111 days on average in 2020, but also up from an average of 107 days last year (and 6.3% above the 5-year average).
Median home prices in North Battleford went from $205,000 to $198,500 (a decrease of 3.2%) and were approximately 7.6% above the 5-year and 7.1% above the 10-year average median price. Year-to-date, the median home price in North Battleford was $185,395 which is 4.6% below the $194,325 price from the same time last year. Median home prices in the region went from $205,000 to $210,000 (an increase of 2.4%) and were approximately 12.7% above the 5-year and 16.6% above the 10-year average median price. Year-to-date, the median home price in the region was $179,228 which is 1.6% above the $176,475 price from the same time last year.
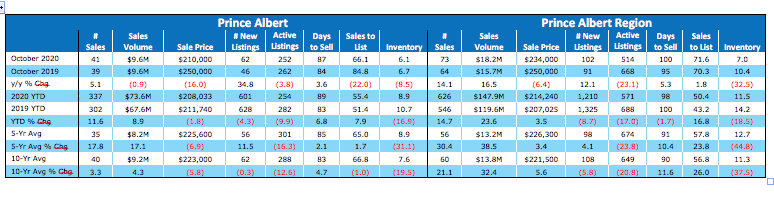
Prince Albert
Sales in Prince Albert were up 5.1%, going from 39 in October 2019 to 41 in October 2020, and up 14.1% in the overall region, going from 64 to 73. In Prince Albert, sales were 17.8% above the 5-year average (and 3.3% above the 10-year average), while in the larger region, sales were 30.4% above the 5-year average (and 21.1% above the 10-year average). Year-to-Date (YTD) sales in Prince Albert rose 11.6% over last year, increasing from 302 to 337, while YTD sales in the larger region rose 14.7%, going from 546 to 626.
Sales volume was down 0.9% in the city, going from $9.6M to $9.6M in 2020 (17.1% above the 5-year average, and 4.3% above the 10-year average). YTD sales volume in the city was $73.6M, an increase of 8.9% from last year. In the region, sales volume was up 23.6%, going from $119.6M to $147.9M (38.5% above the 5-year average and 32.4% above the 10-year average). YTD sales volume increased 23.6% in the region, rising from $119.6M in 2019 to $147.9M in 2020.
In Prince Albert, the number of new listings in October 2020 rose 34.8%, going from 46 to 62 (11.5% above the 5-year average and 0.3% below the 10-year average), while in the region, new listings rose 12.1% from 91 last year to 102 this year (4.1% below the 5-year average and 5.8% below the 10-year average). YTD new listings in the city fell 4.3%, going from 628 to 601, while in the larger region, the number of new listings to date fell 8.7%, going from 1,325 to 1,210. Active listings fell 3.8% in Prince Albert (down from 262 to 252) and fell 23.1% in the region (down from 668 to 514).
Inventory in Prince Albert stood at 6.1 months (which is 8.5% below the level last year and 31.1% below the 5-year average), while the sales to listing ratio was 66.1%, suggesting that market conditions favour sellers. Inventory in the larger region stood at 7.0 months (which is 32.5% below the level last year and 44.8% below the 5-year average), while the sales to listing ratio was 71.6%, suggesting that market conditions favour sellers.
Homes in Prince Albert stayed on the market an average of 87 days in October—up 3.6% from 84 days last year (and above the 5-year average of 85 days and above the 10-year average of 83 days). Homes in the region stayed on the market longer than homes in the city at 100 days on average in 2020, but also up from an average of 95 days last year (and 10.4% above the 5-year average).
Median home prices in Prince Albert went from $250,000 to $210,000 (a decrease of 16.0%) and were approximately 6.9% below the 5-year and 5.8% below the 10-year average median price. Year-to-date, the median home price in Prince Albert was $208,033 which is 1.8% below the $211,740 price from the same time last year. Median home prices in the region went from $250,000 to $234,000 (a decrease of 6.4%) and were approximately 3.4% above the 5-year and 5.6% above the 10-year average median price. Year-to-date, the median home price in the region was $214,240 which is 3.5% above the $207,025 price from the same time last year.
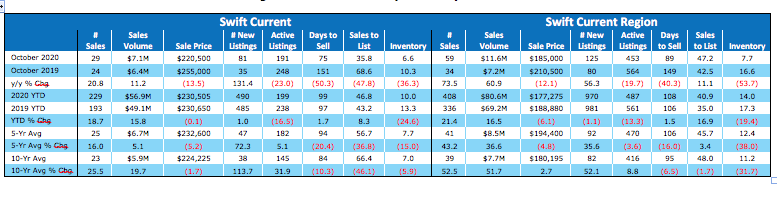
Swift Current
Sales in Swift Current were up 20.8%, going from 24 in October 2019 to 29 in October 2020, and up 73.5% in the overall region, going from 34 to 59. In Swift Current, sales were 16.0% above the 5-year average (and 25.5% above the 10-year average), while in the larger region, sales were 43.2% above the 5-year average (and 52.5% above the 10-year average). Year-to-Date (YTD) sales in Swift Current rose 18.7% over last year, increasing from 193 to 229, while YTD sales in the larger region rose 21.4%, going from 336 to 408.
Sales volume was up 11.2% in the city, going from $6.4M to $7.1M in 2020 (5.1% above the 5-year average, and 19.7% above the 10-year average). YTD sales volume in the city was $56.9M, an increase of 15.8% from last year. In the region, sales volume was up 16.5%, going from $69.2M to $80.6M (36.6% above the 5-year average and 51.7% above the 10-year average). YTD sales volume increased 16.5% in the region, rising from $69.2M in 2019 to $80.6M in 2020.
In Swift Current, the number of new listings in October 2020 rose 131.4%, going from 35 to 81 (72.3% above the 5-year average and 113.7% above the 10-year average), while in the region, new listings rose 56.2% from 80 last year to 125 this year (35.6% below the 5-year average and 52.1% above the 10-year average). YTD new listings in the city rose 1.0%, going from 485 to 490, while in the larger region, the number of new listings to date fell 1.1%, going from 981 to 970. Active listings fell 23.0% in Swift Current (down from 248 to 191) and fell 19.7% in the region (down from 564 to 453).
Inventory in Swift Current stood at 6.6 months (which is 36.3% below the level last year and 15.0% below the 5-year average), while the sales to listing ratio was 35.8%, suggesting that market conditions favour buyers. Inventory in the larger region stood at 7.7 months (which is 53.7% below the level last year and 38.0% below the 5-year average), while the sales to listing ratio was 47.2%, suggesting balanced market conditions.
Homes in Swift Current stayed on the market an average of 75 days in October—down 50.3% from 151 days last year (but below the 5-year average of 94 days and below the 10-year average of 84 days). Homes in the region stayed on the market longer than homes in the city at 89 days on average in 2020, but also down from an average of 149 days last year (and 16.0% below the 5-year average).
Median home prices in Swift Current went from $255,000 to $220,500 (a decrease of 13.5%) and were approximately 5.2% below the 5-year and 1.7% below the 10-year average median price. Year-to-date, the median home price in Swift Current was $230,505 which is 0.1% below the $230,650 price from the same time last year. Median home prices in the region went from $210,500 to $185,000 (a decrease of 12.1%) and were approximately 4.8% below the 5-year and 2.7% above the 10-year average median price. Year-to-date, the median home price in the region was $177,275 which is 6.1% below the $188,880 price from the same time last year.
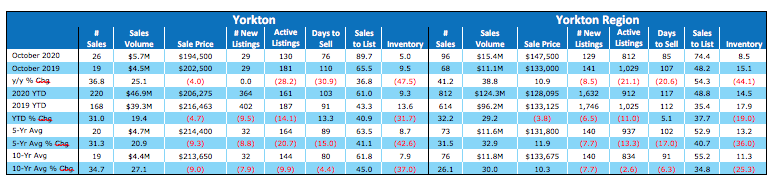
Yorkton
Sales in Yorkton were up 36.8%, going from 19 in October 2019 to 26 in October 2020, and up 41.2% in the overall region, going from 68 to 96. In Yorkton, sales were 31.3% above the 5-year average (and 34.7% above the 10-year average), while in the larger region, sales were 31.5% above the 5-year average (and 26.1% above the 10-year average). Year-to-Date (YTD) sales in Yorkton rose 31.0% over last year, increasing from 168 to 220, while YTD sales in the larger region rose 32.2%, going from 614 to 812.
Sales volume was up 25.1% in the city, going from $4.5M to $5.7M in 2020 (20.9% above the 5-year average, and 27.1% above the 10-year average). YTD sales volume in the city was $46.9M, an increase of 19.4% from last year. In the region, sales volume was up 29.2%, going from $96.2M to $124.3M (32.9% above the 5-year average and 30.0% above the 10-year average). YTD sales volume increased 29.2% in the region, rising from $96.2M in 2019 to $124.3M in 2020.
In Yorkton, the number of new listings in October 2020 stayed flat at 29 (8.8% below the 5-year average and 7.9% below the 10-year average), while in the region, new listings fell 8.5% from 141 last year to 129 this year (7.7% below the 5-year average and 7.7% below the 10-year average). YTD new listings in the city fell 9.5%, going from 402 to 364, while in the larger region, the number of new listings to date fell 6.5%, going from 1,746 to 1,632. Active listings fell 28.2% in Yorkton (down from 181 to 130) and fell 21.1% in the region (down from 1,029 to 812).
Inventory in Yorkton stood at 5.0 months (which is 47.5% below the level last year and 42.6% below the 5-year average), while the sales to listing ratio was 89.7%, suggesting that market conditions favour sellers. Inventory in the larger region stood at 8.5 months (which is 44.1% below the level last year and 36.0% below the 5-year average), while the sales to listing ratio was 74.4%, suggesting that market conditions favour sellers.
Homes in Yorkton stayed on the market an average of 76 days in October—down 30.9% from 110 days last year (but below the 5-year average of 89 days and below the 10-year average of 80 days). Homes in the region stayed on the market longer than homes in the city at 85 days on average in 2020, but also down from an average of 107 days last year (and 17.0% below the 5-year average).
Median home prices in Yorkton went from $202,500 to $194,500 (a decrease of 4.0%) and were approximately 9.3% below the 5-year and 9.0% below the 10-year average median price. Year-to-date, the median home price in Yorkton was $206,275 which is 4.7% below the $216,463 price from the same time last year. Median home prices in the region went from $133,000 to $147,500 (an increase of 10.9%) and were approximately 11.9% above the 5-year and 10.3% above the 10-year average median price. Year-to-date, the median home price in the region was $128,095 which is 3.8% below the $133,125 price from the same time last year.


