
Continuing to defy earlier predictions of a weak housing market due to COVID, the Saskatchewan real estate market remains strong and has outperformed last year’s market. Across the province, sales were up over 54% from last November (and up 22.7% year-to-date), going from 697 to 1,077, new listings were down just over 4% (and down 14.6% year-to-date), going from 1,499 to 1,437) and the median sale price was up close to 1% (and essentially unchanged year-to-date), going from $265,000 to $267,574. Inventories were also down in 18 of the 19 markets that the SRA tracks. Increased restrictions in place due to the rise in COVID cases throughout the province haven’t deterred people from buying and selling real estate. “Even before the new restrictions were in place, we had our members suspend open houses again and required them to wear masks with clients”, said SRA CEO Jason Yochim, “to help make sure that people stayed safe while buying and selling homes.” And these safety precautions have helped to instill confidence in the market, making it easier for people to be in the market. Median sales prices were up in 11 of the 19 markets that the SRA tracks (with Melfort and Weyburn seeing the strongest declines while Swift Current and the Yorkton Region saw the greatest increases), while the numbers of sales were up in 18 of 19 markets. The strong real estate recovery seen after the province went into lockdown from March to May has continued to carry over into November. “Although November and December are generally much slower compared with the summer months, over 50% more sales than last November is simply amazing,” said Yochim. As the year draws to a close and inventory levels continue to be at low throughout much of the province, the steps that the SRA has taken to ensure the safety of the real estate market, combined with continued pent-up demand, could help to make this one of the best years for real estate in a long time.
Southeast Saskatchewan
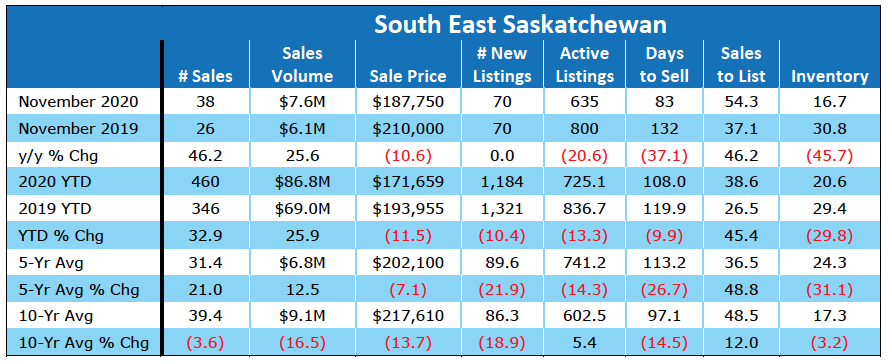
Sales in south east Saskatchewan were up 46.2%, going from 26 in November 2019 to 38 in November 2020, up 21.0% from the 5-year average (and 3.6% below the 10-year average). The total number of sales in Estevan rose 18.0% (going from 11 to 13) and fell 36.4% in Weyburn (going from 11 to 7). Sales in Estevan were 22.6% above the 5-year average (and 5.1% below the 10-year average), while they were 22.2% below the 5-year average (and 37.5% below the 10-year average) in Weyburn. Year-to-Date (YTD) sales in the overall region were up 32.9% over last year, going from 26 to 38, and with YTD sales in Estevan rising from 81 to 125, but flat in Weyburn at 118.
Sales volume in the region rose 25.6%, going from $6.1M to $7.6M in 2020 (12.5% above the 5-year average, and 16.5% below the 10-year average). Sales volume in Estevan rose 47.7%—$18.2M to $26.9M in 2020 (24.0% above the 5-year average and 8.8% below the 10-year average), while it decreased 54.9% in Weyburn—$2.6M to $1.2M (38.5% below the 5-year average and 57.1% below the 10-year average). YTD sales volume in the region rose from $69.0M to $86.8M in 2020 (an increase of 25.9%), with Estevan seeing a 47.7% rise and Weyburn seeing no change in the YTD sales volume.
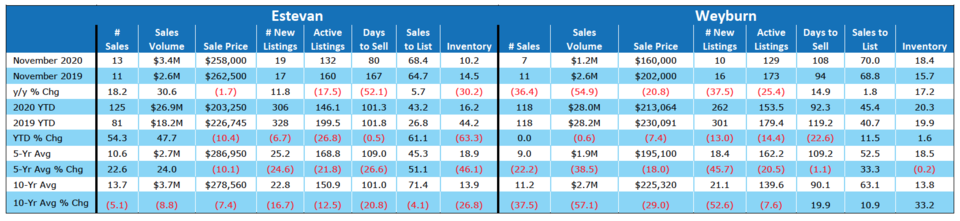
The number of new listings in southeast Saskatchewan was flat at 70 (21.9% below the 5-year average and 18.9% below the 10-year average). The numbers of new listings in Estevan were up from 17 last year to 19 this year (a rise of 11.8%), while in Weyburn, new listings decreased from 16 last year to 10 this year (a fall of 37.5%). Active listings were down 20.6% across the region (800 in 2019 to 635 in 2020), down 17.5% in Estevan (160 to 132), and down 25.4% in Weyburn (173 to 129).
Inventory in southeast Saskatchewan stood at 16.7 months (which is 45.7% below the level last year and 31.1% below the 5-year average), while the sales to listing ratio was 54.3%, suggesting balanced market conditions. Inventory in Estevan stood at 10.2 months (which is 30.2% below the level last year and 46.1% below the 5-year average), while the sales to listing ratio was 68.4%, suggesting that market conditions favour sellers. Inventory in Weyburn stood at 18.4 months (which is 17.2% above the level last year and 0.2% below the 5-year average), while the sales to listing ratio was 70.0%, suggesting that market conditions favour sellers.
In 2020, homes stayed on the market an average of 83 days in southeast Saskatchewan, down 37.1% from 132 days last year (and 26.7% below the 5-year average of 113 days and 14.5% below the 10-year average of 97 days). Homes in Estevan stayed on the market for less time than homes in the larger region at 80 days on average in 2020, but also down from an average of 167 days last year (and 26.6% below the 5-year average). Homes in Weyburn stayed on the market longer than homes in the larger region at 108 days on average in 2020, but also up from an average of 94 days last year (and 1.1% below the 5-year average).
Median home prices in the region fell 10.6%, going from $210,000 to $187,750 (7.1% below the 5-year average median price of $202,100 and 13.7% below the 10-year average median price of $217,610). Year-to-date, the median home price in southeast Saskatchewan was $171,659, which is 11.5% below the $193,955 price from the same time last year. Median home prices in Estevan went from $262,500 to $258,000 (a decrease of 1.7%) and were approximately 10.1% below the 5-year and 7.4% below the 10-year average median price. Year-to-date, the median home price in the region was $203,250, which is 10.4% below the $226,745 price from the same time last year. Median home prices in Weyburn went from $202,000 to $160,000 (a decrease of 20.8%) and were approximately 18.0% below the 5-year and 29.0% below the 10-year average median price. Year-to-date, the median home price in the region was $213,064, which is 7.4% below the $230,091 price from the same time last year.
Moose Jaw
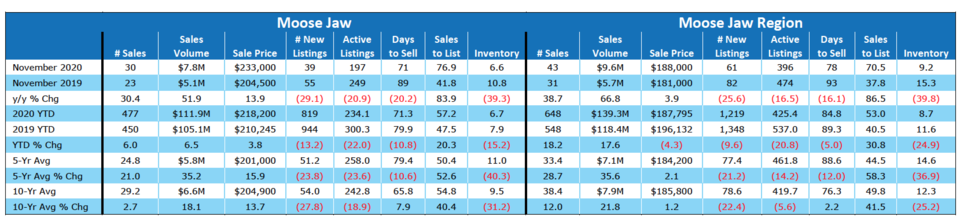
Sales in Moose Jaw were up 30.4%, going from 23 in November 2019 to 30 in November 2020, and up 38.7% in the overall region, going from 31 to 43. In Moose Jaw, sales were 21.0% above the 5-year average (and 2.7% above the 10-year average), while in the larger region, sales were 28.7% above the 5-year average (and 12.0% above the 10-year average). Year-to-Date (YTD) sales in Moose Jaw rose 6.0% over last year, increasing from 450 to 477, while YTD sales in the larger region rose 18.2%, going from 548 to 648.
Sales volume was up 51.9% in the city, going from $5.1M to $7.8M in 2020 (35.2% above the 5-year average, and 18.1% above the 10-year average). YTD sales volume in the city was $111.9M, an increase of 6.5% from last year. In the region, sales volume was up 17.6%, going from $118.4M to $139.3M (35.6% above the 5-year average and 21.8% above the 10-year average). YTD sales volume increased 17.6% in the region, rising from $118.4M in 2019 to $139.3M in 2020.
In Moose Jaw, the number of new listings in November 2020 fell 29.1%, going from 55 to 39 (23.8% below the 5-year average and 27.8% below the 10-year average), while in the region, new listings fell 25.6% from 82 last year to 61 this year (21.2% below the 5-year average and 22.4% below the 10-year average). YTD new listings in the city fell 13.2%, going from 944 to 819, while in the larger region, the number of new listings to date fell 9.6%, going from 1,348 to 1,219. Active listings fell 20.9% in Moose Jaw (down from 249 to 197) and fell 16.5% in the region (down from 474 to 396).
Inventory in Moose Jaw stood at 6.6 months (which is 39.3% below the level last year and 40.3% below the 5-year average), while the sales to listing ratio was 76.9%, suggesting that market conditions favor sellers. Inventory in the larger region stood at 9.2 months (which is 39.8% below the level last year and 36.9% below the 5-year average), while the sales to listing ratio was 70.5%, suggesting that market conditions favor sellers.
Homes in Moose Jaw stayed on the market an average of 71 days in November—down 20.2% from 89 days last year (but below the 5-year average of 79 days and above the 10-year average of 66 days). Homes in the region stayed on the market longer than homes in the city at 78 days on average in 2020, but also down from an average of 93 days last year (and 12.0% below the 5-year average).
Median home prices in Moose Jaw went from $204,500 to $233,000 (an increase of 13.9%) and were approximately 15.9% above the 5-year and 13.7% above the 10-year average median price. Year-to-date, the median home price in Moose Jaw was $218,200, which is 3.8% above the $210,245 price from the same time last year. Median home prices in the region went from $181,000 to $188,000 (an increase of 3.9%) and were approximately 2.1% above the 5-year and 1.2% above the 10-year average median price. Year-to-date, the median home price in the region was $187,795, which is 4.3% below the $196,132 price from the same time last year.
Regina
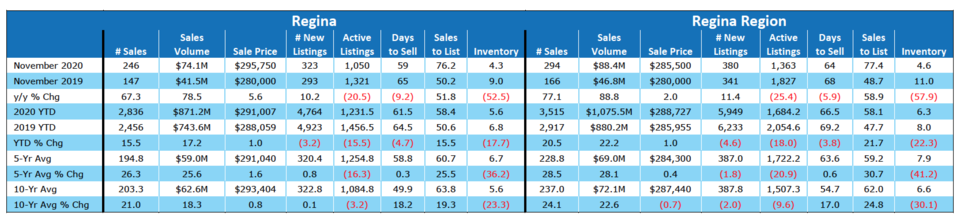
Sales in Regina were up 67.3%, going from 147 in November 2019 to 246 in November 2020, and up 77.1% in the overall region, going from 166 to 294. In Regina, sales were 26.3% above the 5-year average (and 21.0% above the 10-year average), while in the larger region, sales were 28.5% above the 5-year average (and 24.1% above the 10-year average). Year-to-Date (YTD) sales in Regina rose 15.5% over last year, increasing from 2,456 to 2,836, while YTD sales in the larger region rose 20.5%, going from 2,917 to 3,515.
Sales volume was up 78.5% in the city, going from $41.5M to $74.1M in 2020 (25.6% above the 5-year average, and 18.3% above the 10-year average). YTD sales volume in the city was $871.2M, an increase of 17.2% from last year. In the region, sales volume was up 22.2%, going from $880.2M to $1,075.5M (28.1% above the 5-year average and 22.6% above the 10-year average). YTD sales volume increased 22.2% in the region, rising from $880.2M in 2019 to $1,075.5M in 2020.
In Regina, the number of new listings in November 2020 rose 10.2%, going from 293 to 323 (0.8% above the 5-year average and 0.1% above the 10-year average), while in the region, new listings rose 11.4% from 341 last year to 380 this year (1.8% below the 5-year average and 2.0% below the 10-year average). YTD new listings in the city fell 3.2%, going from 4,923 to 4,764, while in the larger region, the number of new listings to date fell 4.6%, going from 6,233 to 5,949. Active listings fell 20.5% in Regina (down from 1,321 to 1,050) and fell 25.4% in the region (down from 1,827 to 1,363).
Inventory in Regina stood at 4.3 months (which is 52.5% below the level last year and 36.2% below the 5-year average), while the sales to listing ratio was 76.2%, suggesting that market conditions favor sellers. Inventory in the larger region stood at 4.6 months (which is 57.9% below the level last year and 41.2% below the 5-year average), while the sales to listing ratio was 77.4%, suggesting that market conditions favor sellers.
Homes in Regina stayed on the market an average of 59 days in November—down 9.2% from 65 days last year (and above the 5-year average of 59 days and above the 10-year average of 50 days). Homes in the region stayed on the market longer than homes in the city at 64 days on average in 2020, but also down from an average of 68 days last year (and 0.6% above the 5-year average).
Median home prices in Regina went from $280,000 to $295,750 (an increase of 5.6%) and were approximately 1.6% above the 5-year and 0.8% above the 10-year average median price. The MLS® Home Price Index (HPI)—a more accurate measure of house price trends—is down 7.8% from $268,300 to $289,100. Year-to-date, the median home price in Regina was $291,007, which is 1.0% above the $288,059 price from the same time last year. Median home prices in the region went from $280,000 to $285,500 (an increase of 2.0%) and were approximately 0.4% above the 5-year and 0.7% below the 10-year average median price. Year-to-date, the median home price in the region was $288,727, which is 1.0% above the $285,955 price from the same time last year.
Saskatoon
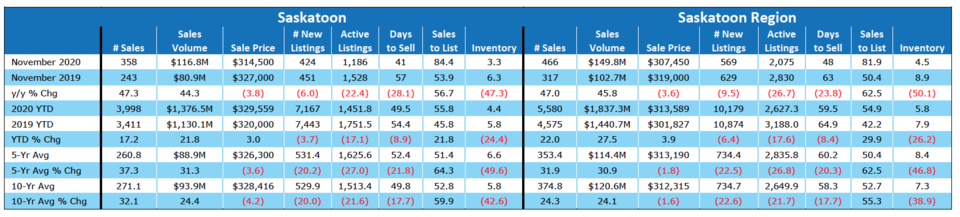
Sales in Saskatoon were up 47.3%, going from 243 in November 2019 to 358 in November 2020, and up 47.0% in the overall region, going from 317 to 466. In Saskatoon, sales were 37.3% above the 5-year average (and 32.1% above the 10-year average), while in the larger region, sales were 31.9% above the 5-year average (and 24.3% above the 10-year average). Year-to-Date (YTD) sales in Saskatoon rose 17.2% over last year, increasing from 3,411 to 3,998, while YTD sales in the larger region rose 22.0%, going from 4,575 to 5,580. Sales volume was up 44.3% in the city, going from $80.9M to $116.8M in 2020 (31.3% above the 5-year average, and 24.4% above the 10-year average). YTD sales volume in the city was$1,376.5M, an increase of 21.8% from last year. In the region, sales volume was up 27.5%, going from $1,440.7M to $1,837.3M (30.9% above the 5-year average and 24.1% above the 10-year average). YTD sales volume increased 27.5% in the region, rising from $1,440.7M in 2019 to$1,837.3M in 2020.
In Saskatoon, the number of new listings in November 2020 fell 6.0%, going from 451 to 424 (20.2% below the 5-year average and 20.0% below the 10-year average), while in the region; new listings fell 9.5% from 629 last year to 569 this year (22.5% below the 5-year average and 22.6% below the 10-year average). YTD new listings in the city fell 3.7%, going from 7,443 to 7,167, while in the larger region, the number of new listings to date fell 6.4%, going from 10,874 to 10,179. Active listings fell 22.4% in Saskatoon (down from 1,528 to 1,186) and fell 26.7% in the region (down from 2,830 to 2,075).
Inventory in Saskatoon stood at 3.3 months (which is 47.3% below the level last year and 49.6% below the 5-year average), while the sales to listing ratio was 84.4%, suggesting that market conditions favor sellers. Inventory in the larger region stood at 4.5 months (which is 50.1% below the level last year and 46.8% below the 5-year average), while the sales to listing ratio was 81.9%, suggesting that market conditions favor sellers.
Homes in Saskatoon stayed on the market an average of 41 days in November—down 28.1% from 57 days last year (but below the 5-year average of 52 days and below the 10-year average of 50 days). Homes in the region stayed on the market longer than homes in the city at 48 days on average in 2020, but also down from an average of 63 days last year (and 20.3% below the 5-year average).
Median home prices in Saskatoon went from $327,000 to $314,500 (a decrease of 3.8%) and were approximately 3.6% below the 5-year and 4.2% below the 10-year average median price. The MLS® Home Price Index (HPI)—a more accurate measure of house price trends—is up 5.4% from $306,600 to $323,400. Year-to-date, the median home price in Saskatoon was $329,559, which is 3.0% above the $320,000 price from the same time last year. Median home prices in the region went from $319,000 to $307,450 (a decrease of 3.6%) and were approximately 1.8% below the 5-year and 1.6% below the 10-year average median price. Year-to-date, the median home price in the region was $313,589, which is 3.9% above the $301,827 price from the same time last year.
Melfort
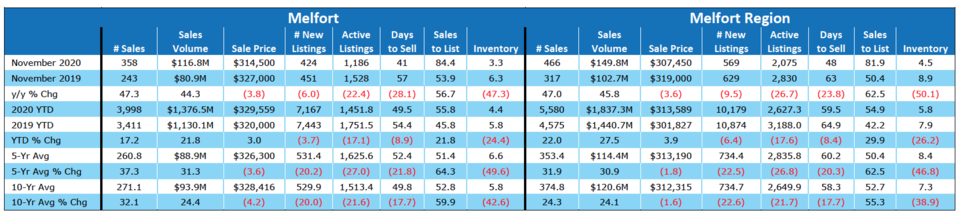
Sales in Melfort were up 33.3%, going from 6 in November 2019 to 8 in November 2020, and up 40.0% in the overall region, going from 15 to 21. In Melfort, sales were 53.8% above the 5-year average (and 14.3% above the 10-year average), while in the larger region, sales were 45.8% above the 5-year average (and 20.7% above the 10-year average). Year-to-Date (YTD) sales in Melfort fell 24.4% over last year, decreasing from 78 to 59, while YTD sales in the larger region fell 7.5%, going from 226 to 209.
Sales volume was down 28.4% in the city, going from $1.8M to $1.3M in 2020 (17.6% above the 5-year average, and 0.3% above the 10-year average). YTD sales volume in the city was $11.9M, a decrease of 24.3% from last year. In the region, sales volume was down 10.9%, going from $37.3M to $33.3M (35.9% above the 5-year average and 23.2% above the 10-year average). YTD sales volume decreased 10.9% in the region, falling from $37.3M in 2019 to $33.3M in 2020.
In Melfort, the number of new listings in November 2020 rose 42.9%, going from 7 to 10 (15.3% below the 5-year average and 18.0% below the 10-year average), while in the region, new listings rose 34.8% from 23 last year to 31 this year (8.8% below the 5-year average and 7.7% below the 10-year average). YTD new listings in the city fell 11.9%, going from 135 to 119, while in the larger region, the number of new listings to date fell 11.1%, going from 476 to 423. Active listings were flat in Melfort at 50 and fell 12.5% in the region (down from 224 to 196).
Inventory in Melfort stood at 6.2 months (which is 25.0% below the level last year and 40.0% below the 5-year average), while the sales to listing ratio was 80.0%, suggesting that market conditions favor sellers. Inventory in the larger region stood at 9.3 months (which is 37.5% below the level last year and 45.4% below the 5-year average), while the sales to listing ratio was 67.7%, suggesting that market conditions favor sellers.
Homes in Melfort stayed on the market an average of 70 days in November—down 17.6% from 85 days last year (and above the 5-year average of 70 days and below the 10-year average of 83 days). Homes in the region stayed on the market longer than homes in the city
at 119 days on average in 2020, but also up from an average of 115 days last year (and 8.2% above the 5-year average).
Median home prices in Melfort went from $252,500 to $166,500 (a decrease of 34.1%) and were approximately 18.0% below the 5-year and 9.1% below the 10-year average median price. Year-to-date, the median home price in Melfort was $184,432, which is 12.4% below the $210,441 price from the same time last year. Median home prices in the region went from $195,000 to $148,000 (a decrease of 24.1%) and were approximately 12.8% below the 5-year and 0.1% below the 10-year average median price. Year-to-date, the median home price in the region was $140,602, which is 5.0% below the $147,961 price from the same time last year.
North Battleford
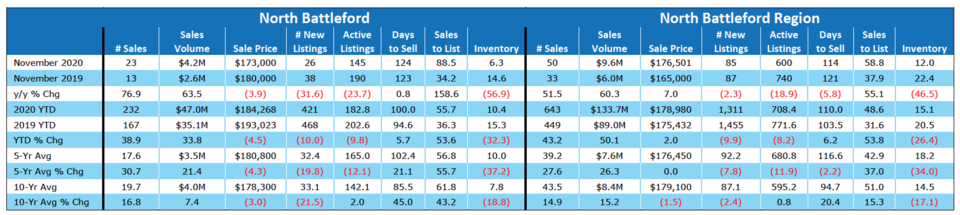
Sales in North Battleford were up 76.9%, going from 13 in November 2019 to 23 in November 2020, and up 51.5% in the overall region, going from 33 to 50. In North Battleford, sales were 30.7% above the 5-year average (and 16.8% above the 10-year average), while in the larger region, sales were 27.6% above the 5-year average (and 14.9% above the 10-year average). Year-to-Date (YTD) sales in North Battleford rose 38.9% over last year, increasing from 167 to 232, while YTD sales in the larger region rose 43.2%, going from 449 to 643.
Sales volume was up 63.5% in the city, going from $2.6M to $4.2M in 2020 (21.4% above the 5-year average, and 7.4% above the 10-year average). YTD sales volume in the city was $47.0M, an increase of 33.8% from last year. In the region, sales volume was up 50.1%, going from $89.0M to $133.7M (26.3% above the 5-year average and 15.2% above the 10-year average). YTD sales volume increased 50.1% in the region, rising from $89.0M in 2019 to $133.7M in 2020.
In North Battleford, the number of new listings in November 2020 fell 31.6%, going from 38 to 26 (19.8% below the 5-year average and 21.5% below the 10-year average), while in the region; new listings fell 2.3% from 87 last year to 85 this year (7.8% above the 5-year average and 2.4% below the 10-year average). YTD new listings in the city fell 10.0%, going from 468 to 421, while in the larger region, the number of new listings to date fell 9.9%, going from 1,455 to 1,311. Active listings fell 23.7% in North Battleford (down from 190 to 145) and fell 18.9% in the region (down from 740 to 600).
Inventory in North Battleford stood at 6.3 months (which is 56.9% below the level last year and 37.2% below the 5-year average), while the sales to listing ratio was 88.5%, suggesting that market conditions favor sellers. Inventory in the larger region stood at 12 months (which is 46.5% below the level last year and 34.0% below the 5-year average), while the sales to listing ratio was 58.8%, suggesting balanced market conditions.
Homes in North Battleford stayed on the market an average of 124 days in November—up 0.8% from 123 days last year (and above the 5-year average of 102 days and above the 10-year average of 86 days). Homes in the region stayed on the market for less time than homes in the city at 114 days on average in 2020, but also down from an average of 121 days last year (and 2.2% below the 5-year average).
Median home prices in North Battleford went from $180,000 to $173,000 (a decrease of 3.9%) and were approximately 4.3% below the 5-year and 3.0% below the 10-year average median price. Year-to-date, the median home price in North Battleford was $184,268, which is 4.5% below the $193,023 price from the same time last year. Median home prices in the region went from $165,000 to $176,501 (an increase of 7.0%) and unchanged from the 5-year and 1.5% below the 10-year average median price. Year-to-date, the median home price in the region was $178,980, which is 2.0% above the $175,432 price from the same time last year.
Prince Albert
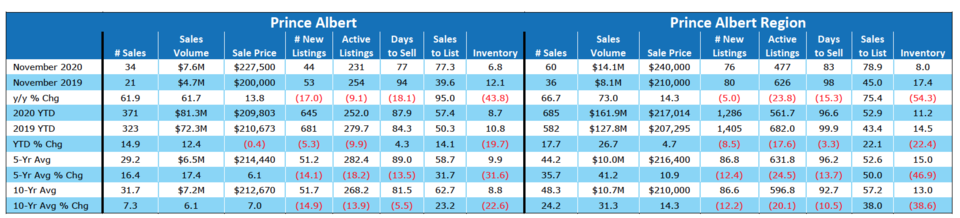
Sales in Prince Albert were up 61.9%, going from 21 in November 2019 to 34 in November 2020, and up 66.7% in the overall region, going from 36 to 60. In Prince Albert, sales were 16.4% above the 5-year average (and 7.3% above the 10-year average), while in the larger region; sales were 35.7% above the 5-year average (and 24.2% above the 10-year average). Year-to-Date (YTD) sales in Prince Albert rose 14.9% over last year, increasing from 323 to 371, while YTD sales in the larger region rose 17.7%, going from 582 to 685.
Sales volume was up 61.7% in the city, going from $4.7M to $7.6M in 2020 (17.4% above the 5-year average, and 6.1% above the 10-year average). YTD sales volume in the city was $81.3M, an increase of 12.4% from last year. In the region, sales volume was up 26.7%, going from $127.8M to $161.9M (41.2% above the 5-year average and 31.3% above the 10-year average). YTD sales volume increased 26.7% in the region, rising from $127.8M in 2019 to $161.9M in 2020.
In Prince Albert, the number of new listings in November 2020 fell 17.0%, going from 53 to 44 (14.1% below the 5-year average and 14.9% below the 10-year average), while in the region; new listings fell 5.0% from 80 last year to 76 this year (12.4% below the 5-year average and 12.2% below the 10-year average). YTD new listings in the city fell 5.3%, going from 681 to 645, while in the larger region, the number of new listings to date fell 8.5%, going from 1,405 to 1,286. Active listings fell 9.1% in Prince Albert (down from 254 to 231) and fell 23.8% in the region (down from 626 to 477).
Inventory in Prince Albert stood at 6.8 months (which is 43.8% below the level last year and 31.6% below the 5-year average), while the sales to listing ratio was 77.3%, suggesting that market conditions favor sellers. Inventory in the larger region stood at 8.0 months (which is 54.3% below the level last year and 46.9% below the 5-year average), while the sales to listing ratio was 78.9%, suggesting that market conditions favor sellers.
Homes in Prince Albert stayed on the market an average of 77 days in November—down 18.1% from 94 days last year (but below the 5-year average of 89 days and below the 10-year average of 82 days). Homes in the region stayed on the market longer than homes in the city at 83 days on average in 2020, but also down from an average of 98 days last year (and 13.7% below the 5-year average).
Median home prices in Prince Albert went from $200,000 to $227,500 (an increase of 13.8%) and were approximately 6.1% above the 5-year and 7.0% above the 10-year average median price. Year-to-date, the median home price in Prince Albert was $209,803, which is 0.4% below the $210,673 price from the same time last year. Median home prices in the region went from $210,000 to $240,000 (an increase of 14.3%) and were approximately 10.9% above the 5-year and 14.3% above the 10-year average median price. Year-to-date, the median home price in the region was $217,014, which is 4.7% above the $207,295 price from the same time last year.
Swift Current
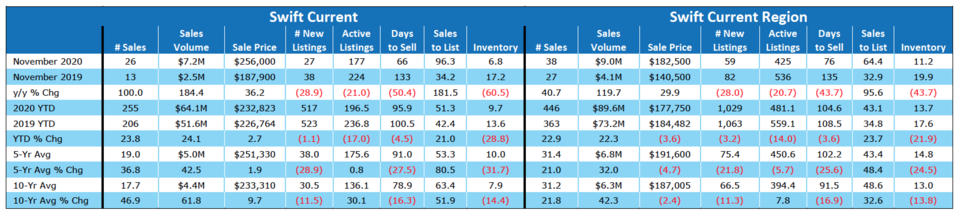
Sales in Swift Current were up 100.0%, going from 13 in November 2019 to 26 in November 2020, and up 40.7% in the overall region, going from 27 to 38. In Swift Current, sales were 36.8% above the 5-year average (and 46.9% above the 10-year average), while in the larger region; sales were 21.0% above the 5-year average (and 21.8% above the 10-year average). Year-to-Date (YTD) sales in Swift Current rose 23.8% over last year, increasing from 206 to 255, while YTD sales in the larger region rose 22.9%, going from 363 to 446.
Sales volume was up 184.4% in the city, going from $2.5M to $7.2M in 2020 (42.5% above the 5-year average, and 61.8% above the 10-year average). YTD sales volume in the city was $64.1M, an increase of 24.1% from last year. In the region, sales volume was up 22.3%, going from $73.2M to $89.6M (32.0% above the 5-year average and 42.3% above the 10-year average). YTD sales volume increased 22.3% in the region, rising from $73.2M in 2019 to $89.6M in 2020.
In Swift Current, the number of new listings in November 2020 fell 28.9%, going from 38 to 27 (28.9% below the 5-year average and 11.5% below the 10-year average), while in the region; new listings fell 28.0% from 82 last year to 59 this year (21.8% below the 5-year average and 11.3% below the 10-year average). YTD new listings in the city fell 1.1%, going from 523 to 517, while in the larger region, the number of new listings to date fell 3.2%, going from 1,063 to 1,029. Active listings fell 21.0% in Swift Current (down from 224 to 177) and fell 20.7% in the region (down from 536 to 425).
Inventory in Swift Current stood at 6.8 months (which is 60.5% below the level last year and 31.7% below the 5-year average), while the sales to listing ratio was 96.3%, suggesting that market conditions favour sellers. Inventory in the larger region stood at 11.2 months (which is 43.7% below the level last year and 24.5% below the 5-year average), while the sales to listing ratio was 64.4%, suggesting that market conditions favour sellers.
Homes in Swift Current stayed on the market an average of 66 days in November—down 50.4% from 133 days last year (but below the 5-year average of 91 days and below the 10-year average of 79 days). Homes in the region stayed on the market longer than homes in the city at 76 days on average in 2020, but also down from an average of 135 days last year (and 25.6% below the 5-year average).
Median home prices in Swift Current went from $187,900 to $256,000 (an increase of 36.2%) and were approximately 1.9% above the 5-year and 9.7% above the 10-year average median price. Year-to-date, the median home price in Swift Current was $232,823, which is 2.7% above the $226,764 price from the same time last year. Median home prices in the region went from $140,500 to $182,500 (an increase of 29.9%) and were approximately 4.7% below the 5-year and 2.4% below the 10-year average median price. Year-to-date, the median home price in the region was $177,750, which is 3.6% below the $184,482 price from the same time last year.
Yorkton
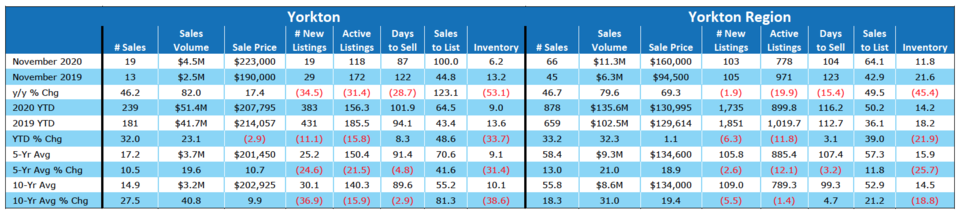
Sales in Yorkton were up 46.2%, going from 13 in November 2019 to 19 in November 2020, and up 46.7% in the overall region, going from 45 to 66. In Yorkton, sales were 10.5% above the 5-year average (and 27.5% above the 10-year average), while in the larger region, sales were 13.0% above the 5-year average (and 18.3% above the 10-year average). Year-to-Date (YTD) sales in Yorkton rose 32.0% over last year, increasing from 181 to 239, while YTD sales in the larger region rose 33.2%, going from 659 to 878.
Sales volume was up 82.0% in the city, going from $2.5M to $4.5M in 2020 (19.6% above the 5-year average, and 40.8% above the 10-year average). YTD sales volume in the city was $51.4M, an increase of 23.1% from last year. In the region, sales volume was up 32.3%, going from $102.5M to $135.6M (21.0% above the 5-year average and 31.0% above the 10-year average). YTD sales volume increased 32.3% in the region, rising from $102.5M in 2019 to $135.6M in 2020.
In Yorkton, the number of new listings in November 2020 fell 34.5%, going from 29 to 19 (24.6% below the 5-year average and 36.9% below the 10-year average), while in the region; new listings fell 1.9% from 105 last year to 103 this year (2.6% below the 5-year average and 5.5% below the 10-year average). YTD new listings in the city fell 11.1%, going from 431 to 383, while in the larger region, the number of new listings to date fell 6.3%, going from 1,851 to 1,735. Active listings fell 31.4% in Yorkton (down from 172 to 118) and fell 19.9% in the region (down from 971 to 778).
Inventory in Yorkton stood at 6.2 months (which is 53.1% below the level last year and 31.4% below the 5-year average), while the sales to listing ratio was 100.0%, suggesting that market conditions favour sellers. Inventory in the larger region stood at 11.8 months (which is 45.4% below the level last year and 25.7% below the 5-year average), while the sales to listing ratio was 64.1%, suggesting that market conditions favour sellers.
Homes in Yorkton stayed on the market an average of 87 days in November—down 28.7% from 122 days last year (but below the 5-year average of 91 days and below the 10-year average of 90 days). Homes in the region stayed on the market longer than homes in the city at 104 days on average in 2020, but also down from an average of 123 days last year (and 3.2% below the 5-year average).
Median home prices in Yorkton went from $190,000 to $223,000 (an increase of 17.4%) and were approximately 10.7% above the 5-year and 9.9% above the 10-year average median price. Year-to-date, the median home price in Yorkton was $207,795, which is 2.9% below the $214,057 price from the same time last year. Median home prices in the region went from $94,500 to $160,000 (an increase of 69.3%) and were approximately 18.9% above the 5-year and 19.4% above the 10-year average median price. Year-to-date, the median home price in the region was $130,995, which is 1.1% above the $129,614 price from the same time last year.


